Dashboards
Download ready Grafana dashboards for editor experience and collaboration.
@docx-editor.dev/telemetry is available in version 2.29.0 and later.Two Grafana dashboards report editor performance and collaboration server activity. They include measurements without predefined targets. Use a few weeks of your traffic to set targets and alert thresholds.
Download
| File | What it is | Download |
|---|---|---|
editor-experience.json | Grafana dashboard: input delay, engine work, opens, and refused edits and tracked changes. | editor-experience.json |
collaboration.json | Grafana dashboard: server state, rooms and people, memory, server work, client status, and refusals. | collaboration.json |
To download both files from a terminal, run:
BASE=https://raw.githubusercontent.com/eigenpal/docx-editor/main/assets/observability
curl -LO "$BASE/grafana/editor-experience.json"
curl -LO "$BASE/grafana/collaboration.json"
The observability assets directory contains these files and their generation script.
Before you import
The dashboards read Prometheus metrics. For every name, see Metrics.
- Editor metrics come through your OpenTelemetry SDK and an OpenTelemetry Protocol (OTLP) collector or Prometheus OTLP receiver. Follow Send to OpenTelemetry and enable the areas in the following example.
- Server metrics come from your collaboration server's
/metricsendpoint. For setup instructions, see Collaboration servers.
The dashboard filters use these labels:
| Label | Comes from |
|---|---|
job | service.name on your OpenTelemetry SDK, or the scrape job of your server. |
deployment_environment | deployment.environment, which you add with attributes and metricLabels. |
app_version | app.version, which you add with attributes and metricLabels. |
docx_editor_version | Added by the telemetry package to every editor metric. |
docx_editor | The scrape target label that marks a collaboration server. |
Add the environment and the app version to the editor metrics, and record the areas that the panels read:
import { createTelemetry } from '@docx-editor.dev/telemetry';
import { otelExporter } from '@docx-editor.dev/telemetry/otel';

export const telemetry = createTelemetry({
  exporters: [otelExporter()],
  include: {
    documentOpen: true,
    editing: true,
    trackedChanges: true,
    fonts: true,
    performance: true,
    // Only in apps with collaboration: the client panels of the Collaboration dashboard.
    collaborationClient: true,
  },
  attributes: { 'deployment.environment': 'production', 'app.version': '4.2.0' },
  metricLabels: ['deployment.environment', 'app.version'],
});
Add the docx_editor target label to each collaboration server. The Collaboration server panels show only targets with this label, including servers that fail every scrape. Client panels use editor metrics and respond only to the Client app filter:
scrape_configs:
  - job_name: collaboration-server
    static_configs:
      - targets: ['collaboration.internal:1235']
        labels:
          docx_editor: collaboration
Import the dashboards
- In Grafana, go to Dashboards > New > Import, and upload
editor-experience.json. - Repeat for
collaboration.json. - Open each dashboard, and select your Prometheus data source in Data source.
- Select the App and Environment values. On Collaboration, select the Server job and its instances.
Editor experience
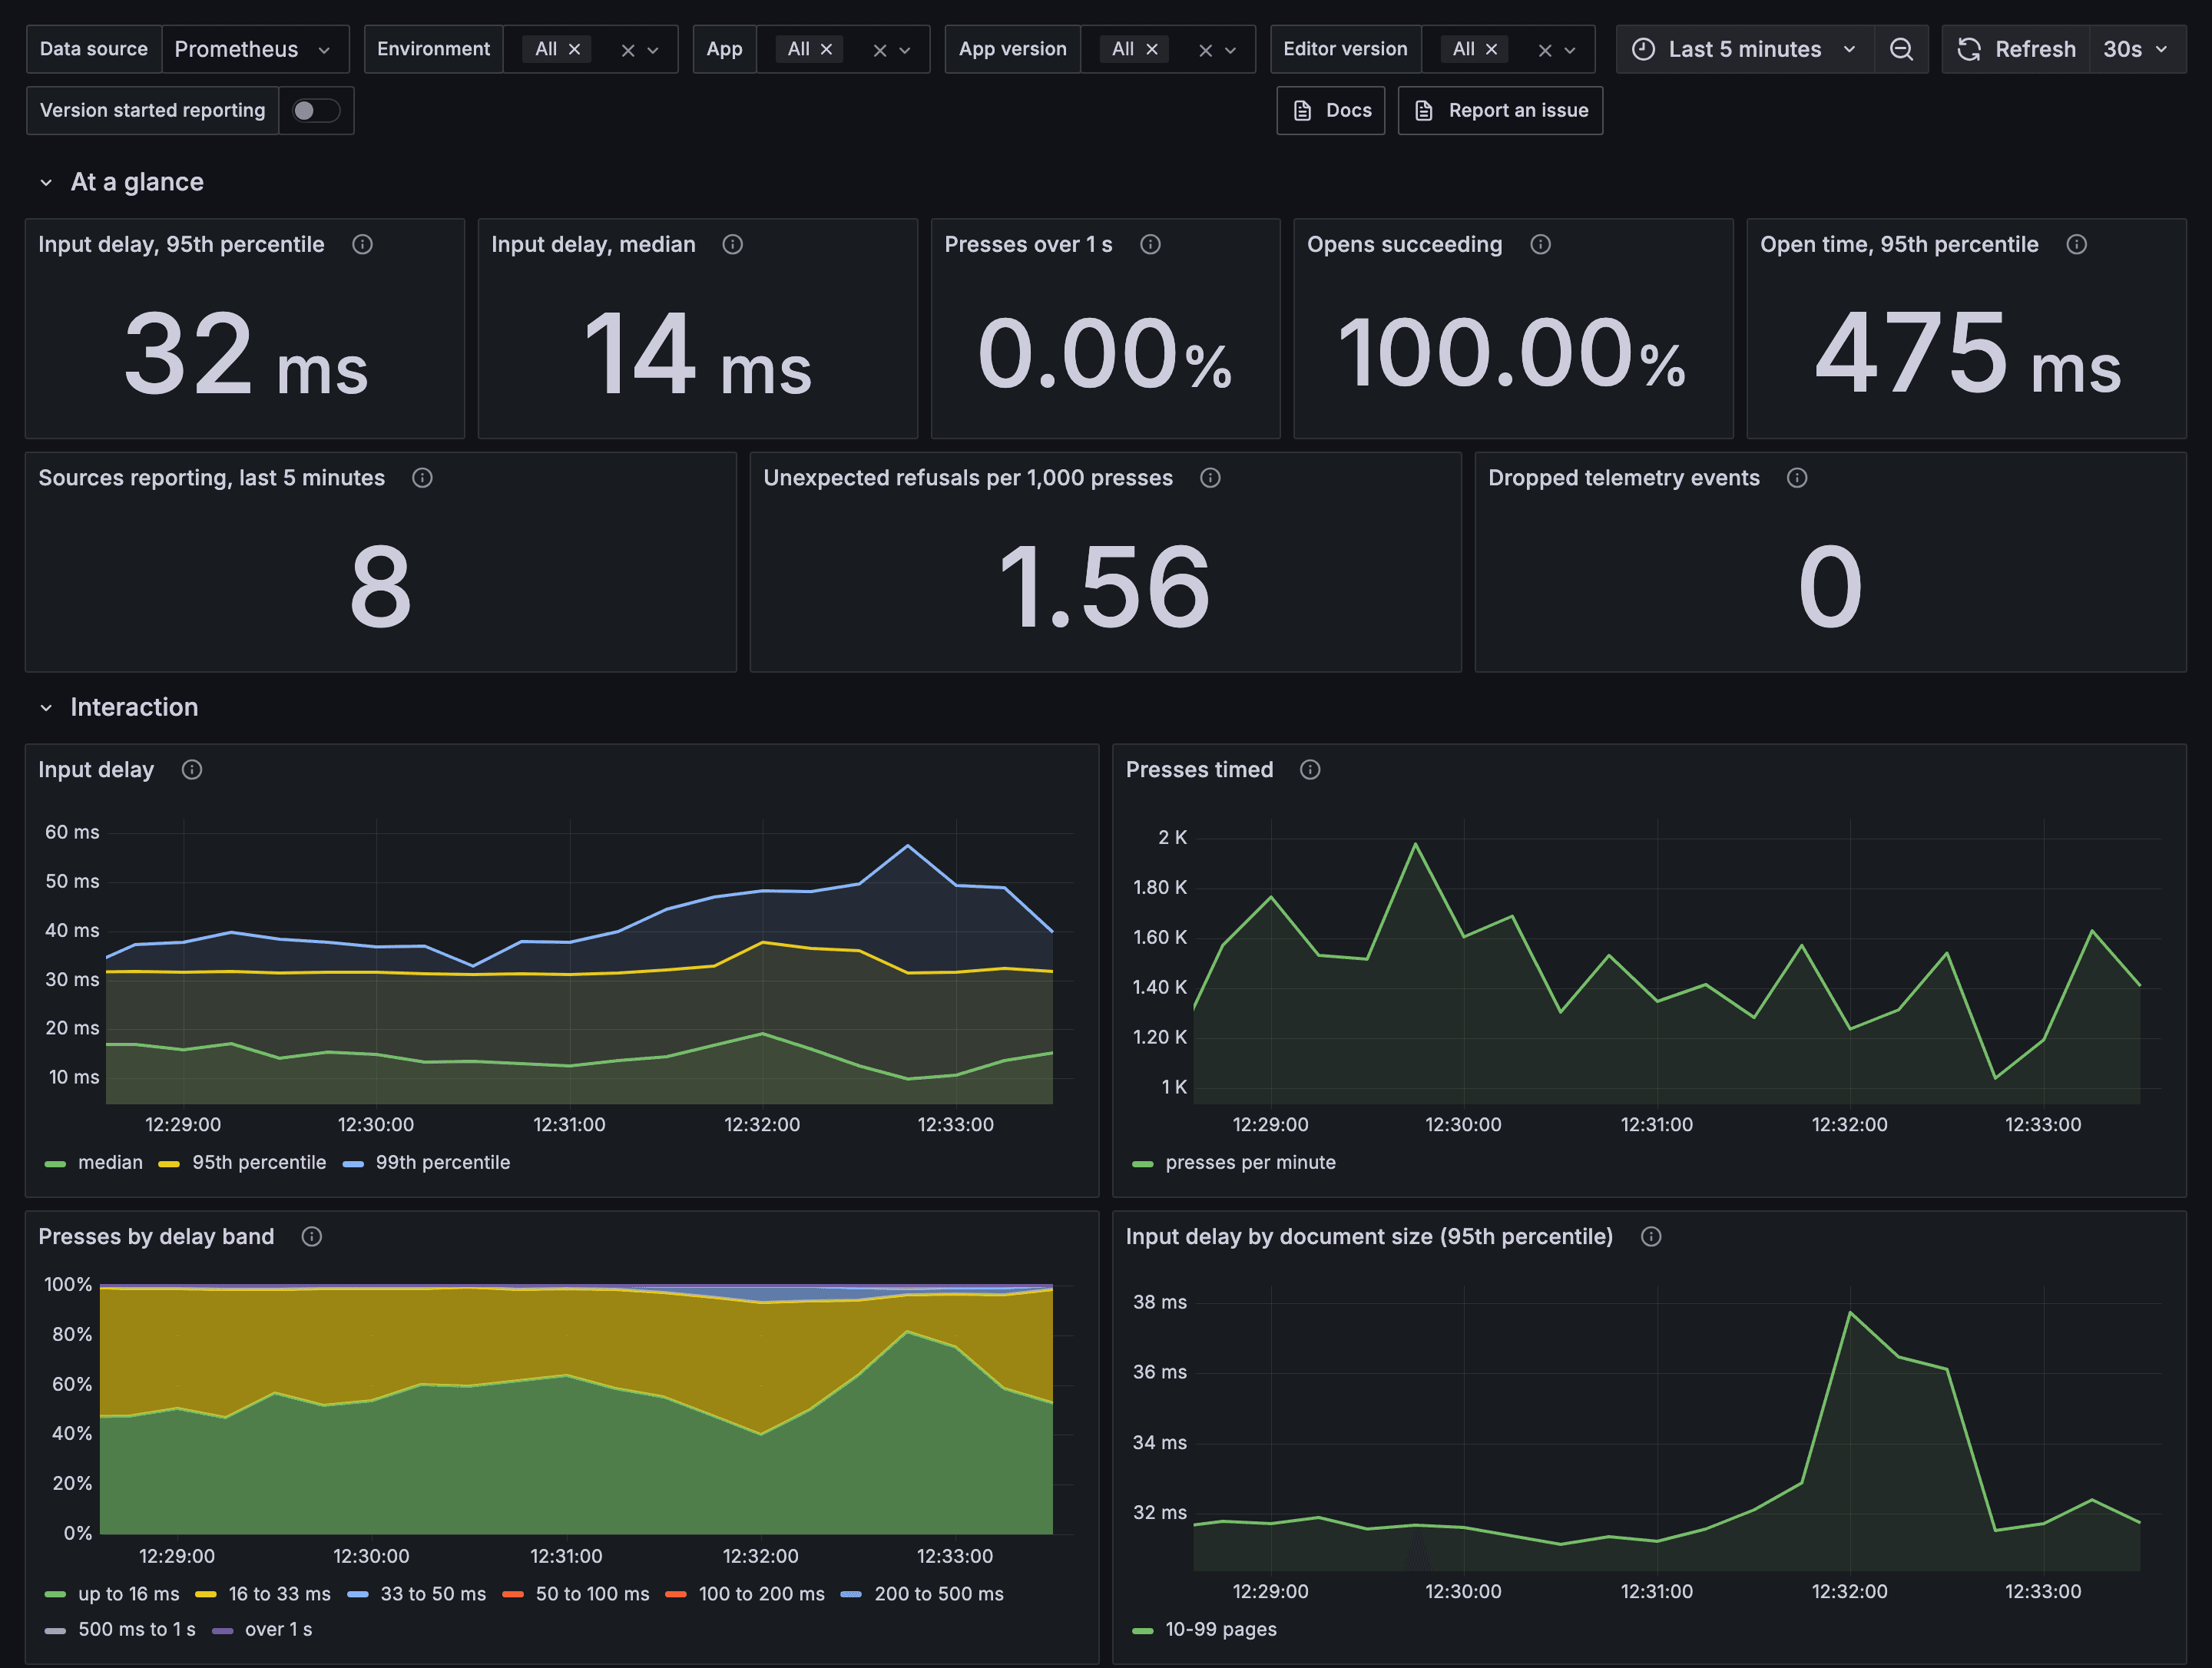
The first row summarizes input delay, presses over 1 second, open success rate, and open time. It also shows reporting metric sources, unexpected refusals per 1,000 presses, and dropped telemetry events.
The remaining rows show:
- Interaction: input delay over time and presses by delay band. Compare delay by document size, app version, editor version, or the same time a week earlier.
- Engine work: engine layout and paint passes by duration band.
- Documents: opens per minute, open time, and refused files by reason.
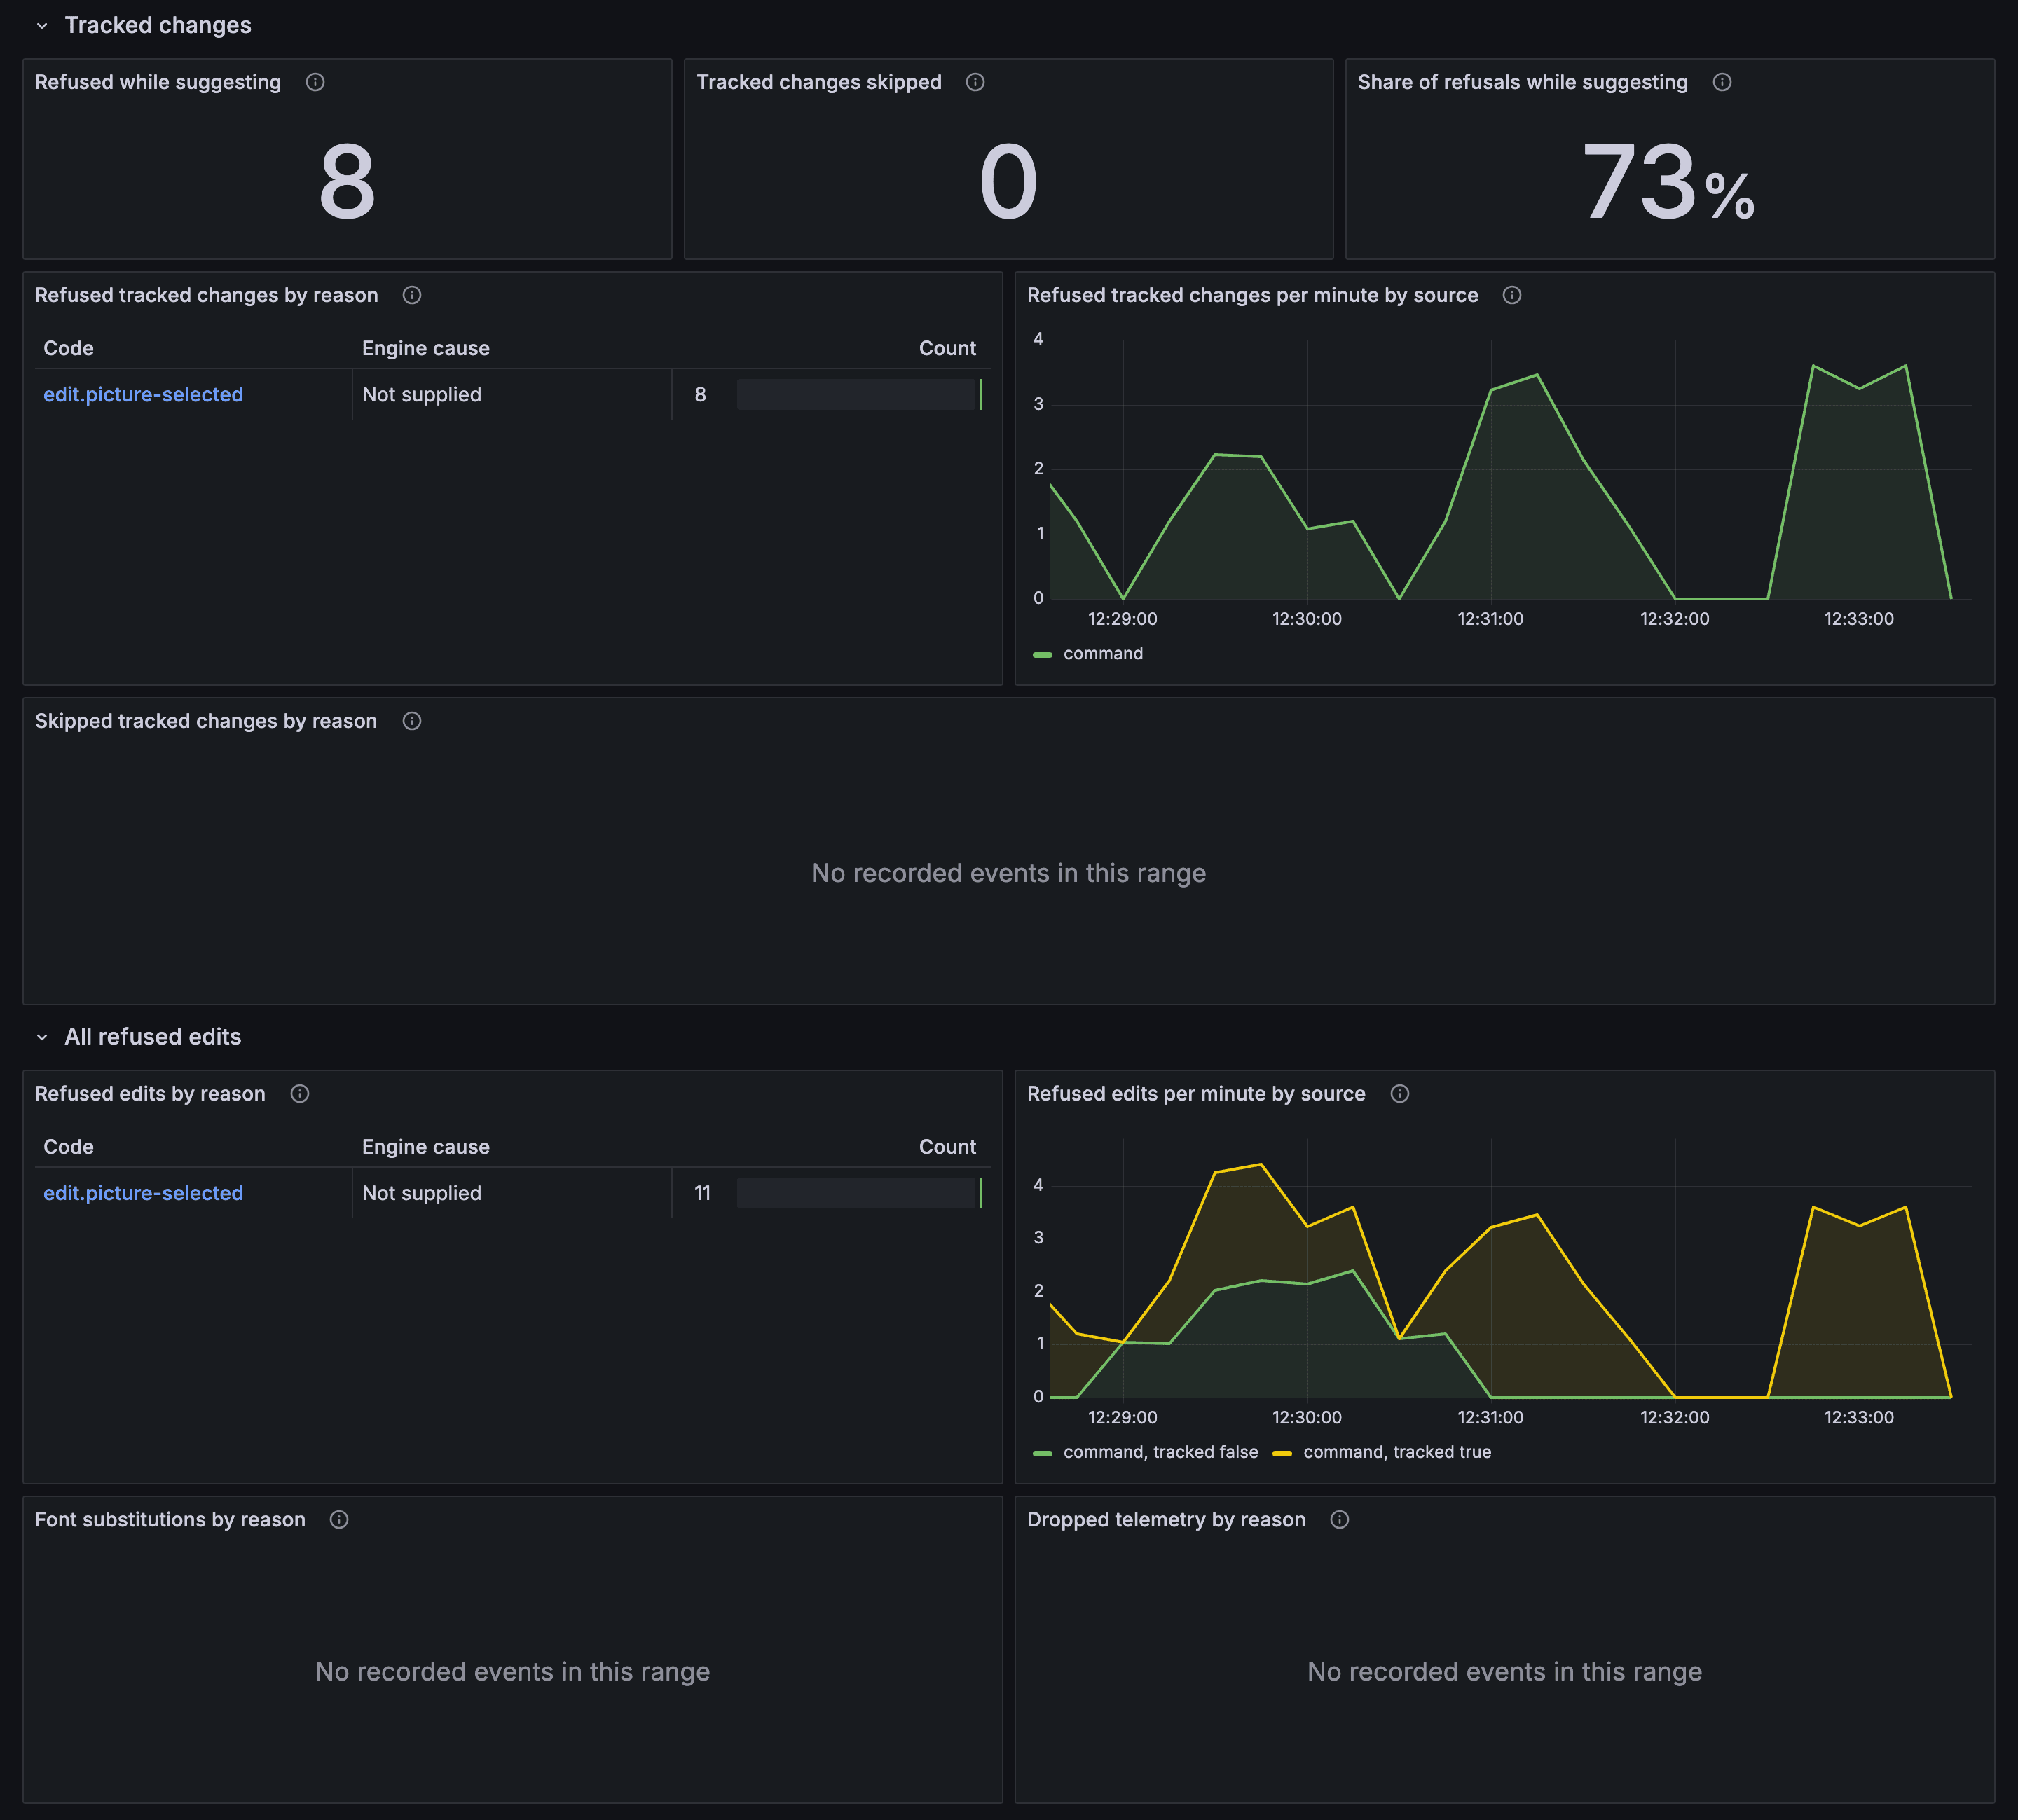
- Tracked changes: edits refused while suggesting, by reason and source. Skipped accept, reject, and reassign requests appear by reason, operation, and change kind.
- All refused edits: refusal codes by source, font substitutions, and dropped telemetry.
Every code in a table links to its hint in Diagnostics.
Input delay percentiles are estimates from timing bands. The highest finite boundary is 1 second. A percentile shown as 1 second falls in the band above 1 second. In that case, use Presses over 1 s.
Collaboration
The first row summarizes server availability, successful room stores, refused connections, client errors, and room limit usage. Other rows show room activity, participants, connections, memory, resource usage, room age, and idle time. They also show load and store times, updates, client status changes, and refusal reasons.
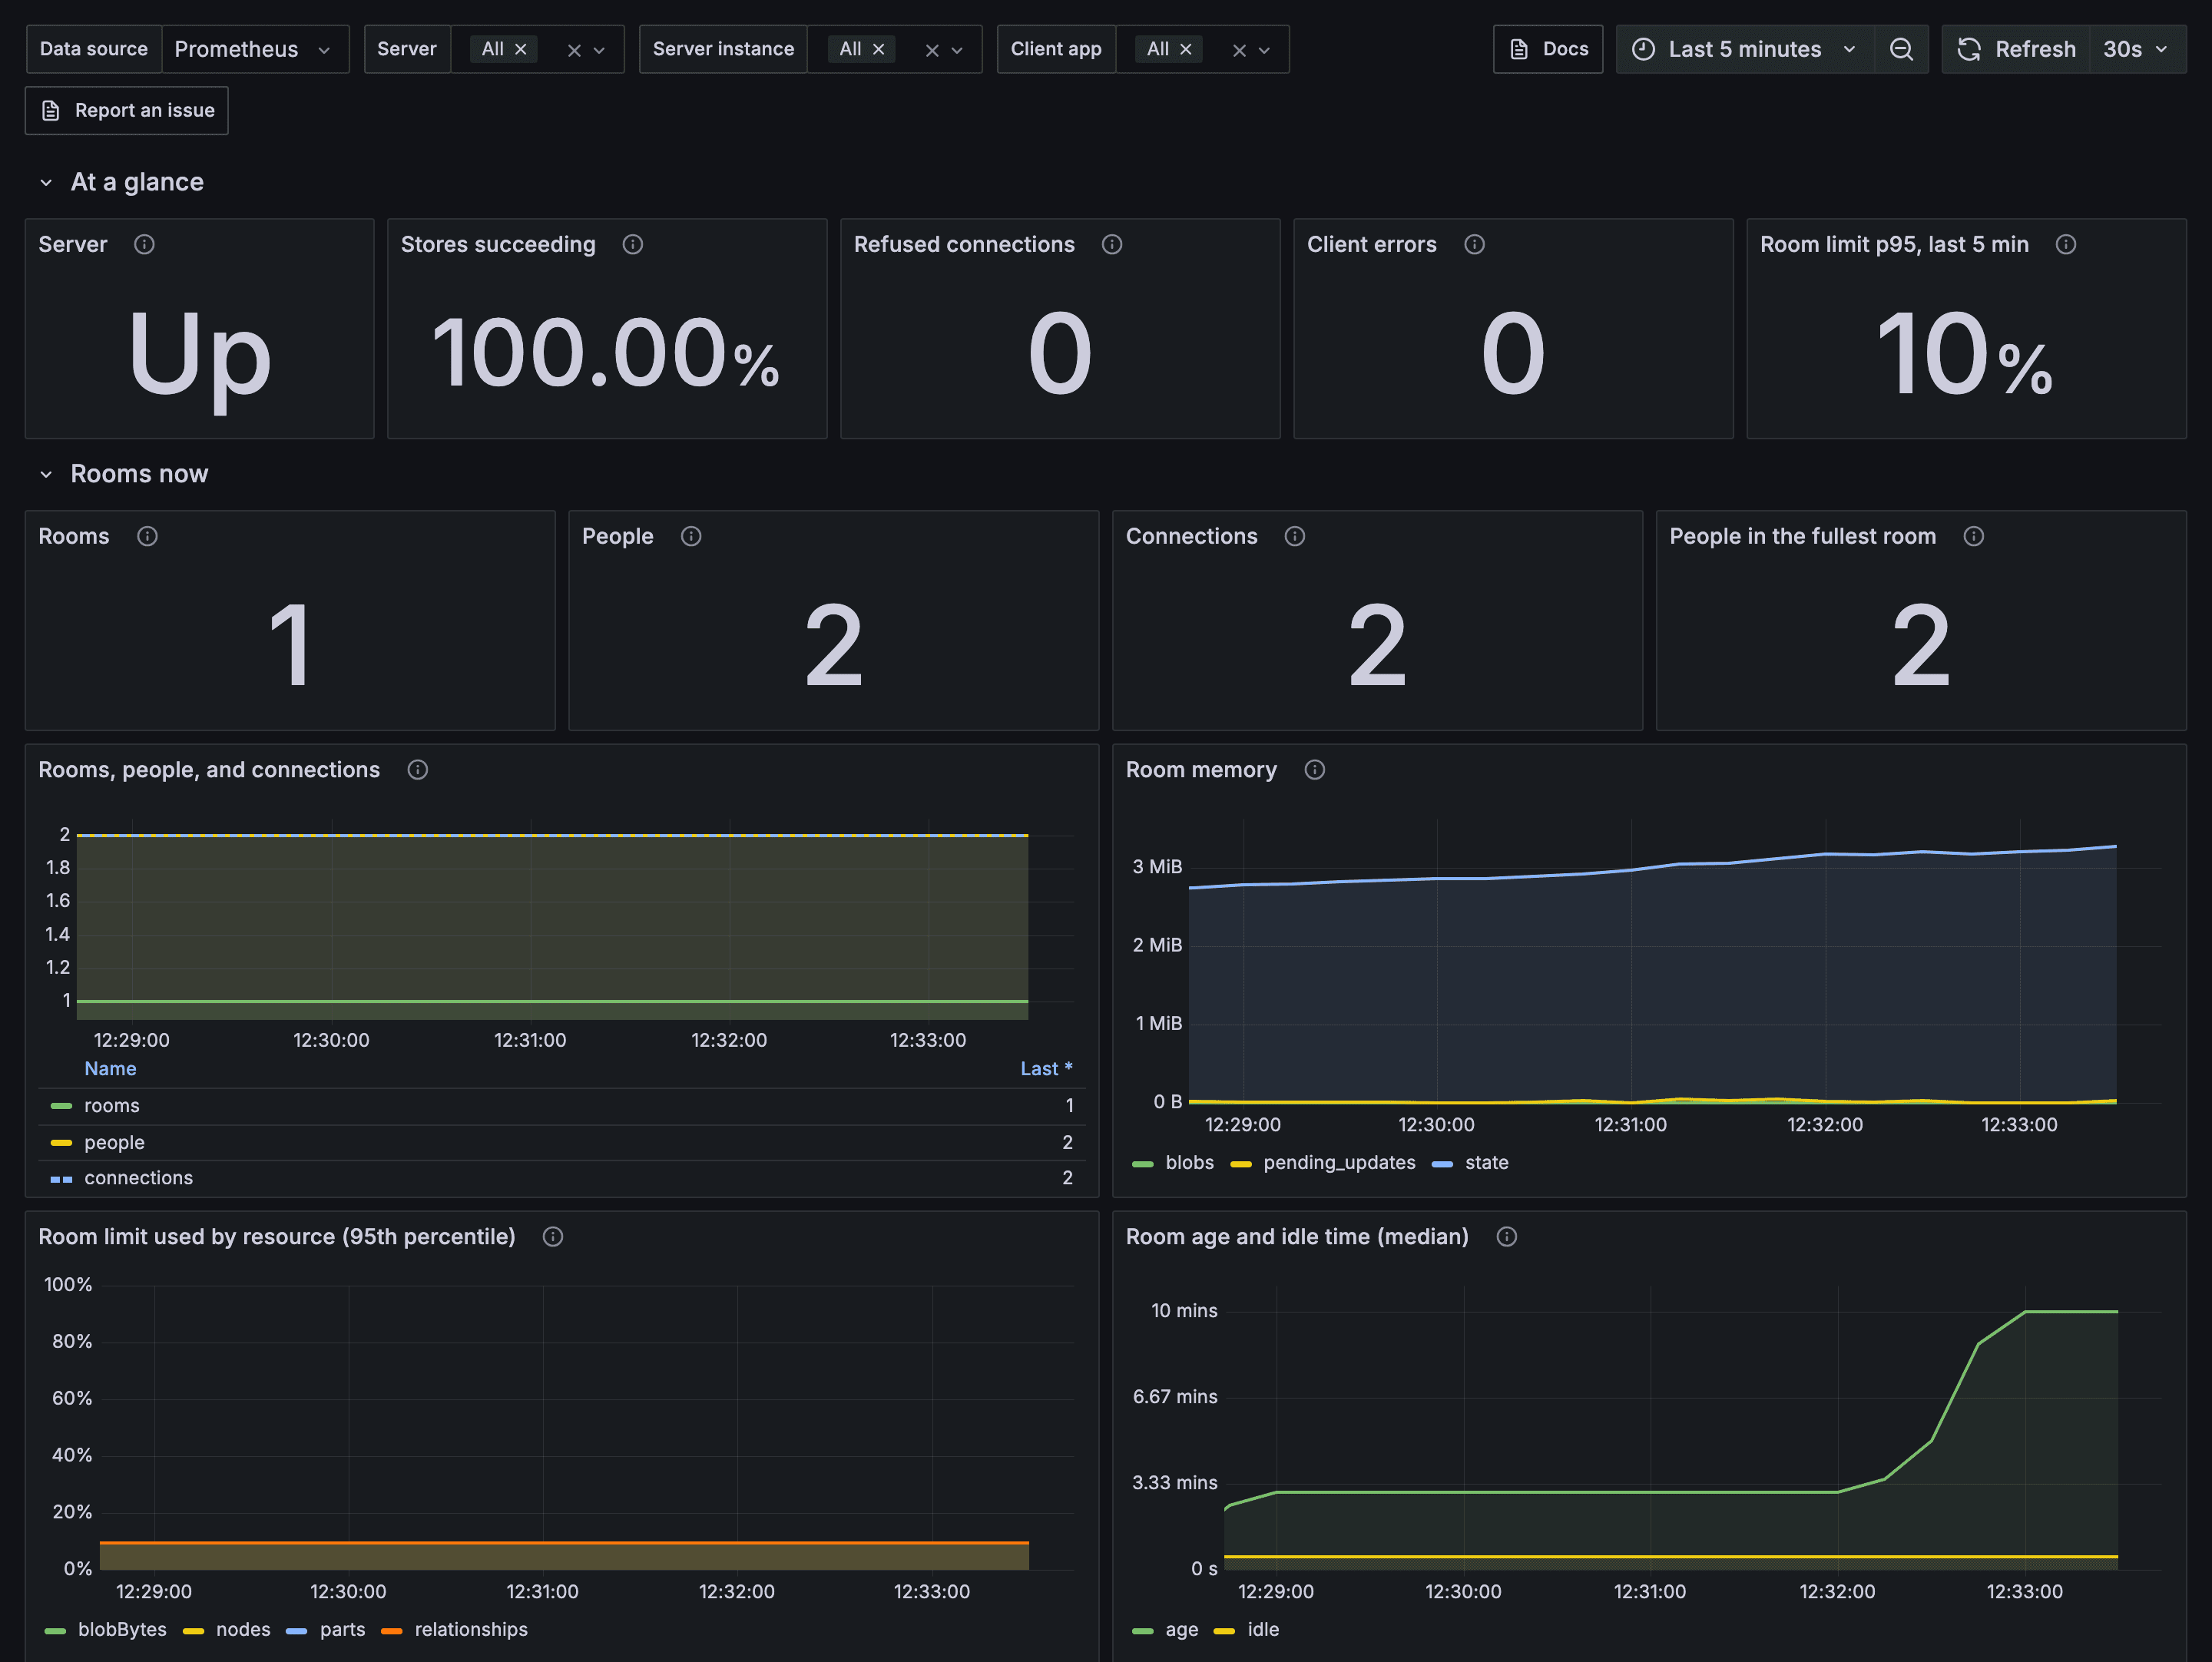
Participant totals include all selected server instances. If instances share rooms through Redis, select one instance to avoid counting the same people more than once.
Try the dashboards locally
The telemetry stack example runs an OpenTelemetry collector, Prometheus, Jaeger, and Grafana with these dashboards. Its simulation script generates editing activity to populate the dashboards. Use it with the single-user example and the collaboration example.
To report a problem with the dashboards, open an issue.